
Hydronic underfloor heating warms your home with water flowing through pipes beneath the floor. Its running cost depends on how much heat your home needs and how the water is heated. [3] [1]
The rooms you heat, your preferred temperature, insulation and energy prices all affect the bill. A useful estimate starts with these details. Below, we use a Sydney reference home to estimate heating-season costs, then explain the design choices that can help you use heating more efficiently.
What could a heating season cost?
Our example starts with a specific 180 m² Sydney home from a government study. Its modelled annual heating need is 2,554 kWh of heat. [9]
We use May–September as a five-month heating season, following the government energy-labelling convention for its Sydney-region reference climate. This includes cooler months either side of the June–August winter. [10]
For this estimate, we use the home’s annual heat requirement as an approximate total for that season. Dividing 2,554 by five gives about 511 kWh of heat per month. This seasonal allocation is our planning assumption; the house study did not publish monthly heating figures.
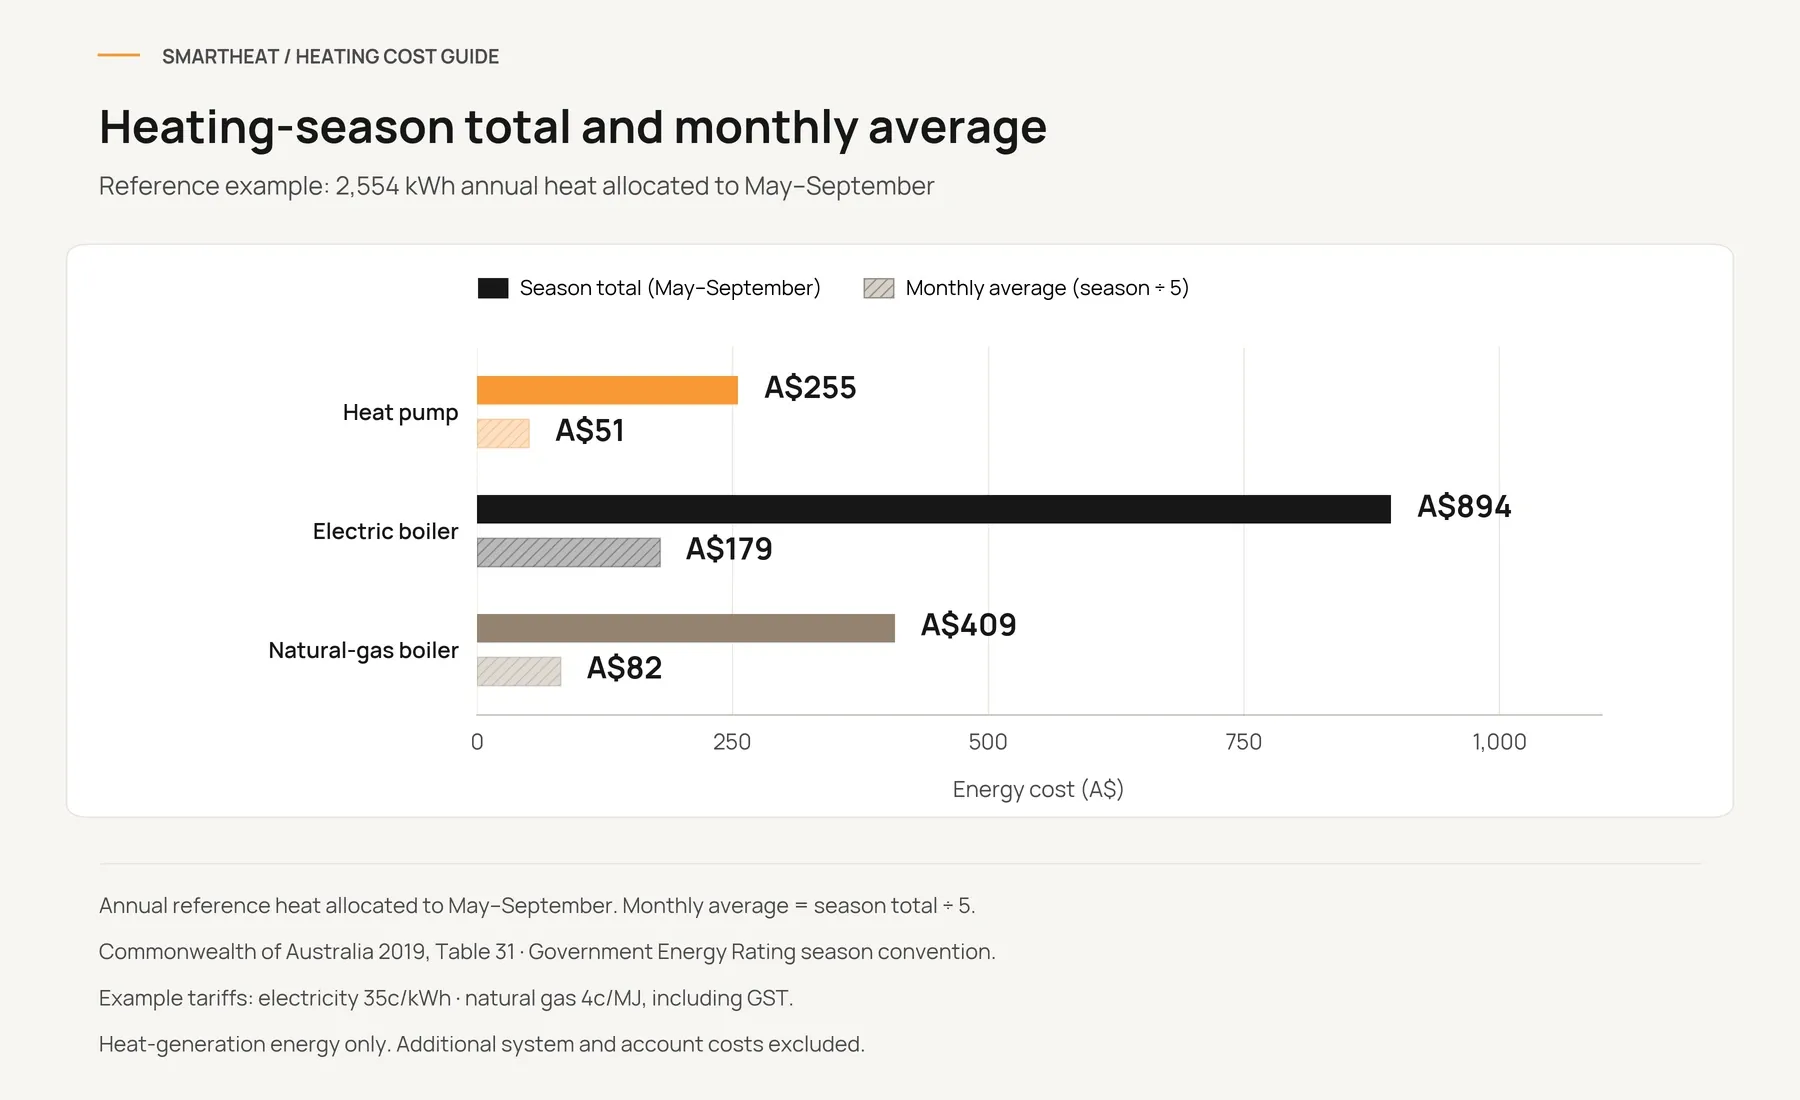
At the prices and performance assumptions below, a heat pump would use about 730 kWh of electricity for the season, costing A$255. The monthly average would be about 146 kWh of electricity and A$51. The table compares three heat sources producing the same amount of heat. The electricity or gas purchased is different from the heat delivered.
The model uses an 18°C room temperature target, with the household out during the day on weekdays and different heating schedules for different rooms. These costs are specific to this example and are not an average winter bill.
Estimated heat-source energy use and costs — May–September
| Heat source | Season energy use | Average monthly energy use | Season energy cost | Average monthly cost |
|---|---|---|---|---|
| Heat pump | 730 kWh electricity | 146 kWh electricity | A$255 | A$51 |
| Electric boiler | 2,554 kWh electricity | 511 kWh electricity | A$894 | A$179 |
| Natural-gas boiler | 10,216 MJ natural gas | 2,043 MJ natural gas | A$409 | A$82 |
The monthly average is the estimated five-month total divided by five. A colder July and a milder September may use different amounts; this is not a forecast for an individual month. Gas use is shown in MJ to match the example gas tariff.
These amounts cover the main heat source’s energy use. Allow extra for pumps, controls, standby use, backup heating, heat lost from the system and applicable supply or demand charges. Installation and servicing are separate. Displayed usage and costs are rounded; calculations use the unrounded figures.
What changes your running costs?
Which rooms you heat
Start by marking the rooms you want warm on a floor plan. Living areas, bedrooms and a home office may need heat at different times. Separate heating zones let you set different temperatures and schedules for those spaces. [1]
For example, a household may use the living room every day, a home office during working hours and a guest bedroom only when visitors stay. A useful design follows that routine and allows enough time for each floor to warm up. Heating fewer rooms can reduce demand, but the saving also depends on heat moving between rooms and escaping from the building.
When you want warmth
Think about when each room needs to feel comfortable. A heated concrete slab warms up slowly and keeps releasing heat after the system reduces its output. Set the schedule around that response, so the room is ready when you need it. [4]
A household at home all day may need a different schedule from one that leaves for work. Share those details early in the design, rather than choosing the same heating hours for every room.
How well your home holds heat
Insulation, windows and draughts affect how quickly warmth escapes. Improving these can reduce the amount of heat your system needs to supply. Consider them alongside the heating layout, especially when building or renovating. [1] [2]
The floor matters too. Suitable insulation beneath a heated slab helps limit heat loss into the ground. Tile, timber and carpet transfer heat differently, so the heating design should suit the chosen finish and its temperature limits. [4] [3]
Your temperature settings
YourHome suggests winter room settings of 18–20°C. Choose a comfortable setting for the people in your home and avoid heating rooms more than they need. [1]
Room temperature and heating-water temperature are separate settings. The thermostats, floor sensors where needed and water controls should work together to provide steady warmth without overheating the room or floor.
Choosing what heats the water
The heat pump, electric boiler and gas boiler in the table all supply warm water to a hydronic floor system. They use different amounts of energy to produce the same quantity of heat, which explains the difference in the example costs. [7] [3]
An electric boiler uses an electric heating element to warm the water. A heat pump transfers heat into the water using electricity, while a gas boiler burns gas. When comparing options, look at their expected performance at the water temperature your floor needs, as well as your energy prices.
Our hydronic heat pump vs gas boiler guide explains the options in more detail. The figures in this article use natural gas; LPG needs a separate fuel-price calculation.
How does monthly heat use change the cost?
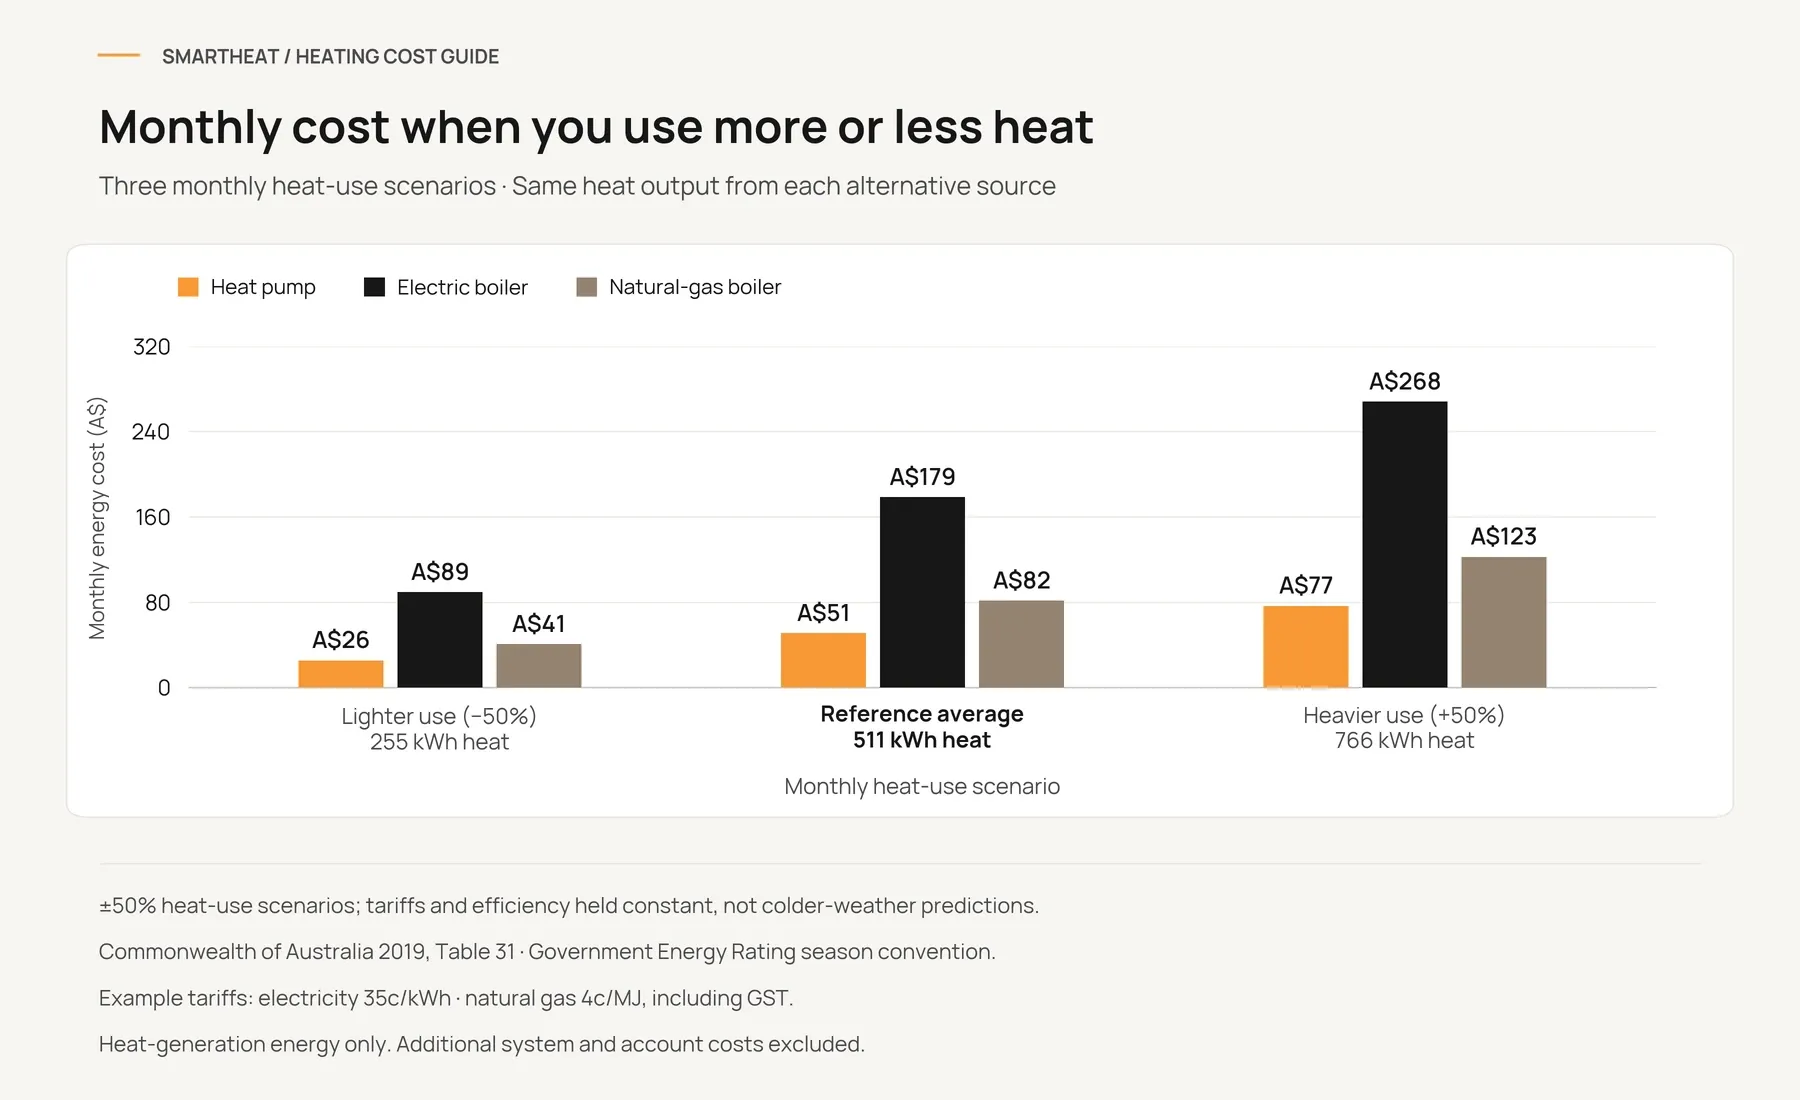
A seasonal average does not mean every month costs the same. Weather and your heating routine can change the amount of heat you need. The comparison below uses about 511 kWh of heat as the reference monthly average. We have chosen 50% less and 50% more heat as comparison examples; those percentages are not estimates of how much a particular colder or milder month will use.
Estimated energy cost for one month at different heat-use levels
| Heat produced in one month | Heat pump | Electric boiler | Natural-gas boiler |
|---|---|---|---|
| 255 kWh — 50% less heat | A$26 | A$89 | A$41 |
| 511 kWh — Reference average | A$51 | A$179 | A$82 |
| 766 kWh — 50% more heat | A$77 | A$268 | A$123 |
Using 50% more heat than the example average would raise the monthly energy cost to about A$77 for the heat pump, A$268 for the electric boiler or A$123 for the gas boiler. At 50% less heat use, those costs fall to about A$26, A$89 or A$41.
These are examples of different monthly usage levels, not forecasts for July or any other month. We keep the same energy prices and equipment efficiencies to show the effect of heat use alone. Actual equipment performance can also change with the weather.
Plan the heating around your project
Building a new home
Decide which rooms need heating before the slab and floor finishes are finalised. Plan the pipe layout, insulation, heating equipment and controls together, while there is still time to adjust the building details.
Renovating
Check the existing floor construction and how much floor height you can add. Then choose a suitable heating layout and finish for the rooms you use. This helps establish what is practical before selecting equipment.
Upgrading an existing system
Check the pipework, controls and water temperature the home needs before replacing the heat source. The new equipment needs to work with the floor system already in place.
Check your energy plan and solar
Use the electricity or gas rate on your own bill when setting a budget. If your electricity plan has different prices at different times of day, check which rates apply during the proposed heating hours. Check any demand charges as well. [5] [6]
Solar panels may help supply an electric heat source during the day. How much they help depends on winter generation, other household electricity use and when the floor needs heat. The example above uses grid energy only and assumes no solar contribution.
Frequently asked questions
Common questions about running costs
Can you estimate my bill from floor area alone?
Floor area is useful for planning, but it does not tell us how much heat the home needs. Insulation, glazing, local weather, temperatures and heating times matter too. The 180 m² reference home has specific modelled conditions; your home needs its own assessment.
Should I leave hydronic underfloor heating on all day?
The right schedule depends on how quickly the floor responds, how well the home holds heat and when you need warmth. A slow-response slab may suit longer heating periods with small temperature changes. Controls adjust the heat supplied as demand changes, so a system available all day does not run at full power all day. That alone does not guarantee a lower bill.
Does the example assume 24-hour heating?
The underlying house model uses an 18°C room-air target and different heating times for different rooms, with weekday daytime absence. It is not continuous whole-home heating. A hydronic floor needs its own schedule to suit its response and your routine; the five-month average does not prescribe daily operating hours.
How can I compare the example with my own usage?
If you have a separate reading for heating electricity, multiply its kWh by your electricity rate. For gas, multiply the heating MJ by your gas rate. For example, 300 kWh of heating electricity at 35c/kWh costs A$105. A whole-home bill also includes other uses, so it cannot be treated as heating-only consumption.
What other costs should I allow for?
Allow for pump and control electricity, standby use, any backup heating, system heat losses and applicable supply or demand charges. Installation and servicing are separate. The example also excludes household hot water and cooling.
What should I share with SmartHeat?
Tell us your suburb, project stage, rooms to heat and when you want them warm. Floor plans, insulation and flooring details, and information about any existing heating system help us understand your options.
How we calculated the example
The 2019 government study models a 180 m², three-bedroom brick-veneer home with a suspended timber floor. We use the uninsulated, south-oriented Sydney case, with an annual heating load of 2,554 kWh. It uses Sydney Observatory Hill weather, an 18°C room-air target and a daytime-away household. Living/dining heating is available 5–10am and 5–11pm on weekdays, and 5am–midnight on weekends; bedrooms use an 8pm–9am schedule. [9]
The separate government energy-labelling method uses Richmond, northwest of Sydney, for its average climate zone. Its cooling season is October–April, with heating assigned to the remaining May–September period. This is an air-conditioner labelling convention; we use it only to choose a comparison season, not as hydronic energy-use data. [10]
AEMO’s 2015 gas forecasting methodology also defines the NSW winter heating period as 1 May–30 September. These sources support the five-month period. They do not establish that the reference house’s annual heat load occurred entirely within those months. [11]
We therefore make one additional planning assumption: the complete modelled annual heating requirement is used as an approximate total for May–September. Its monthly average is 2,554 ÷ 5 = 510.8 kWh of heat. This combines two references into an estimate; it is not a monthly result published by either source or a measured average across Sydney homes.
Estimated season calculations: heat pump, 2,554 ÷ 3.5 = about 729.71 kWh of electricity, costing A$255.40 at 35c/kWh. Electric boiler, 2,554 kWh of electricity, costing A$893.90. Natural-gas boiler, 2,554 ÷ 0.90 × 3.6 = 10,216 MJ of gas, costing A$408.64 at 4c/MJ. We divide each seasonal result by five for the monthly average and calculate before rounding.
The single-month comparison applies 50%, 100% and 150% to the reference average of 510.8 kWh of heat. The exact monthly heat inputs are 255.4, 510.8 and 766.2 kWh; table labels are rounded. The lower and higher inputs illustrate how costs change with usage while tariffs and assumed efficiencies stay fixed. They are not monthly consumption predictions from the government study.
The published heating load is the heat needed by the rooms. We estimate the energy needed to generate that amount, before additional hydronic distribution or storage losses. Pump and control electricity and the other costs listed above need separate allowances. All dollar figures are SmartHeat calculations using the stated equipment and tariff assumptions. Sources checked 4 November 2026. [8]
References
[9] Commonwealth of Australia 2019: Report for Achieving Low Energy Existing Homes — Appendix D2: home p94; settings pp102–105; Table 31, p112.
[10] Australian Government Energy Rating: seasonal calculation assumptions — average climate zone, cooling/heating seasons and Richmond reference climate.
[11] AEMO: 2015 National Gas Forecasting Report methodology — p41, footnote 53: NSW heating-period convention.
[8] Australian Government: calculating appliance running costs
[1] YourHome: heating and cooling
[2] NSW BASIX: heating and cooling loads
[3] Energy Saving Trust: underfloor heating
[4] YourHome: concrete slab floors